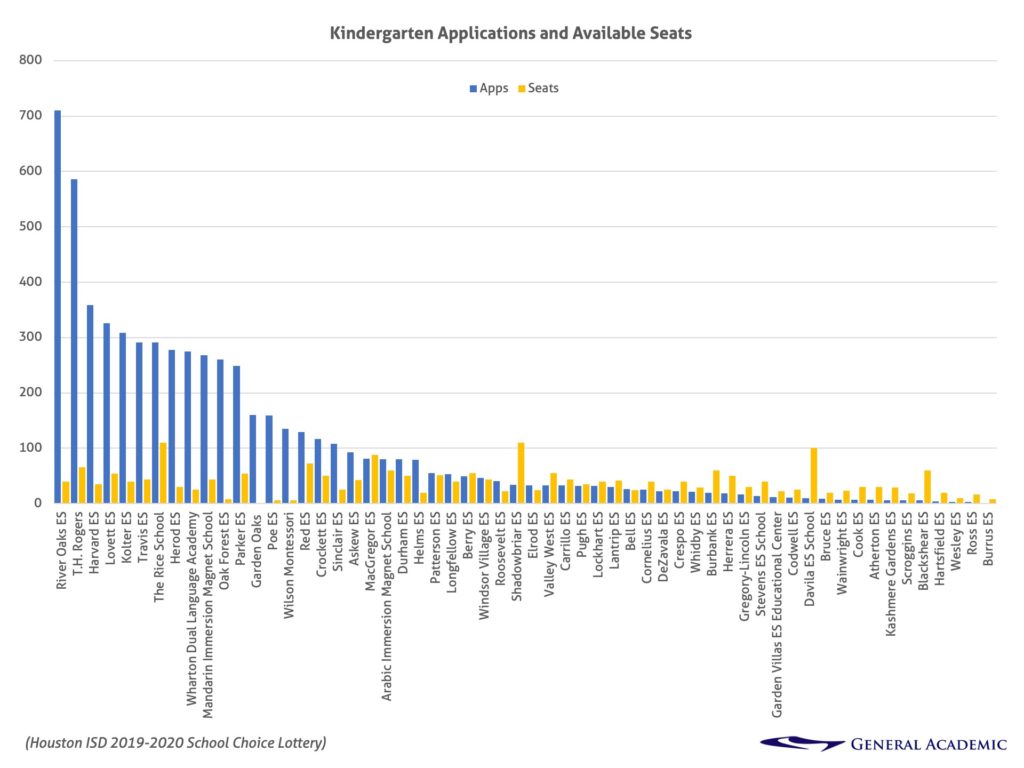
River Oaks, TH Rogers, and Harvard elementary schools retained their titles as the most popular choices. Qualified families had an average of 20% chance of getting into one of the top schools. For the 2019-2020 academic year, 2,548 students submitted 6,491 applications for kindergarten to 58 HISD magnet elementary schools.
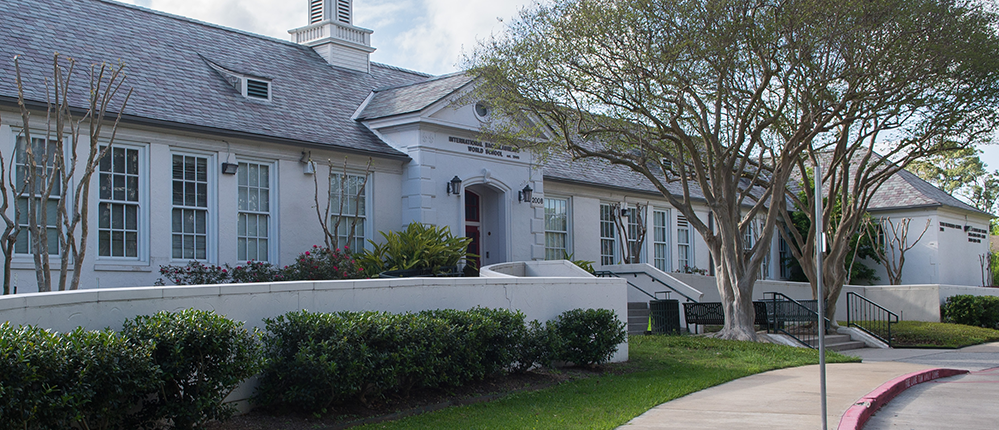
(Image Caption – With 710 applications for 40 seats, River Oaks Elementary remains one of the most popular and difficult to get into HISD elementary schools. Photo via HISD).
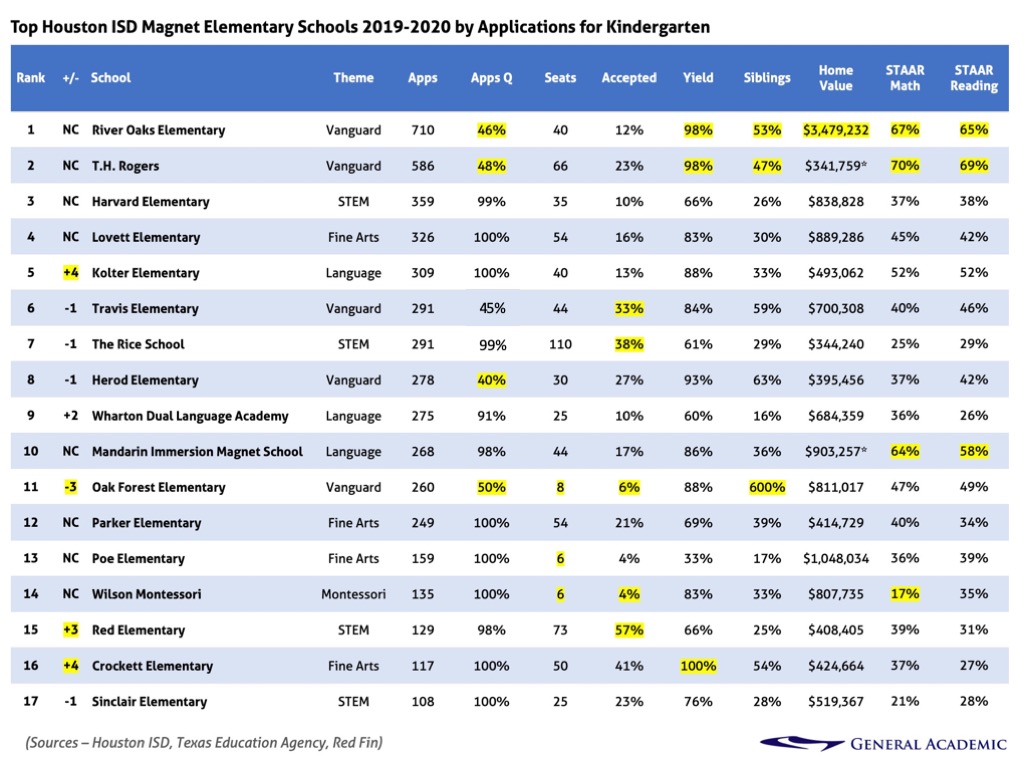
While there were 2,284 kindergarten seats open in total, the 17 most popular schools received 78% of the applications and had 753 seats available for an average acceptance rate of about 20% or 5 qualified applications per seat. With few exceptions, students are excited about attending these schools as nearly 80% of families quickly accepted their offer of admission.
These popular elementary schools are objectively good when measured by their STAAR test results. On average, 40% of students at these schools are scoring at the highest, “Masters” level on the STAAR reading and math tests, which is nearly twice as good as the district average of 21%.
Families at these schools seem very happy. These top elementary schools have exceptional “loyalty rates” as measured by the percentage of applicants coming from families who already send a student to the school. While only 25% of available seats are specifically reserved for siblings of currently enrolled and continuing students, on average 35% of the seats could potentially be filled with only siblings at the top schools (the average across all HISD prime entry grades is 16%). At the most popular elementary schools like River Oaks, Rogers, and Herod, siblings could potentially fill up as many as 60% of the available seats.
Several schools made big jumps in popularity versus last year’s lottery. The Arabic Immersion Magnet (not in the top 17) moved up 5 spots followed by Kolter (+4), Crockett (+4), and Red (+3). Oak Forest fell 3 spots, which is appropriate given that its limited availability makes for an essentially wasted application (families may have applied to a maximum of 5 schools).
Students lucky enough to attend these schools also get to enjoy posh surroundings and classmates from the zoned neighborhood. The average home listing price around the top schools is a jumbo $768,230; by comparison the homes that feed into #57 Ross Elementary are listed for an average price of just $69,273.
West University, Roberts, Twain, and Bush Elementaries are not part of the magnet lottery, because they can barely accommodate their zoned, neighborhood students let alone out of zone transfers.
Several more elementary schools in rich neighborhoods are set to lose their magnet status due to full enrollment from their zoned neighborhoods. Garden Oaks Montessori accepted 160 applicants this year but had zero seats to give them. Oak Forest, Poe, and Wilson Montessori had fewer than 8 seats available, which amounted to acceptance rates of less than 5%.
How to Read the Table
- Theme indicates the type of magnet school; parents can learn more about the different themes at HISD’s website
- Apps refers to the number of applications received from out of zone (OOZ) students and excludes zoned neighborhood students
- Apps Q is the percentage of OOZ apps that are actually qualified to be considered for admission
- Seats is the number of spaces available to OOZ students and excludes availability for zoned students
- Accepted is the percent of qualified applicants offered admission on March 21, 2019
- Yield is the percent of applicants who had accepted their offer of admission by April 5, 2019
- Siblings is the percent of OOZ applicants from siblings of currently enrolled students
- Home Value is the average listing price of homes in the school’s neighborhood zone or immediate vicinity
- STAAR Math is the percent of all students at the school who earned the “Masters” designation on the STAAR math tests
- STAAR Reading is the percent of all students at the school who earned the “Masters” designation on STAAR reading tests
HISD presented this data as accurate on April 5, 2019, but the numbers will change continuously until school starts on August 26, 2019, as students finalize their enrollment plans


